
It is no secret that Denver is one of the hottest real estate markets in the United States. High demand from a growing population and extremely low inventory are the key drivers of that strength. Understanding inventory levels is a key factor in the recent surge in prices and can provide insight into how long we can expect a strong Denver housing market.*
Many people only consider the overall inventory, but a deeper look into inventory in specific price ranges and in certain areas of the Denver metropolitan area* will paint very different pictures. What price range is your home? What neighborhood are you in? What is inventory like for similar homes in the area?
The Denver real estate market began to strengthen after the financial crisis around 2011. In March 2011 there were 34,657 homes (of all price ranges and types) on the market in the Denver metro area. Four years later in March 2015 that number was down to 4,756. This March it was down further to 4,641.
To really understand how these figures affect home prices we also need to look at the annual and monthly sales. In 2011, there were 37,189 homes sold. In 2015, there were 54,625. That increase is nearly 47% in yearly sales.
What these numbers show is a rapidly decreasing supply and increasing demand. The result is a rise in home prices, but we can gain more insight into the market with a closer look at inventory of homes within specific price ranges in the Denver real estate market.
Inventory by price range
The overall inventory in Denver from March 2015 to March 2016 was down just under 2.5% from 4,756 to 4,641 homes on the market. Although this looks like a slowdown and stabilization of the market, a look at the inventory in different price ranges illustrates a different situation.
Nearly everyone in Denver has heard the stories of multiple offers, bidding wars and contract terms that most people cannot fathom, such as guaranteeing appraisal amounts, foregoing inspections, free rent backs and cash offers. These are common in some price ranges, but not all.
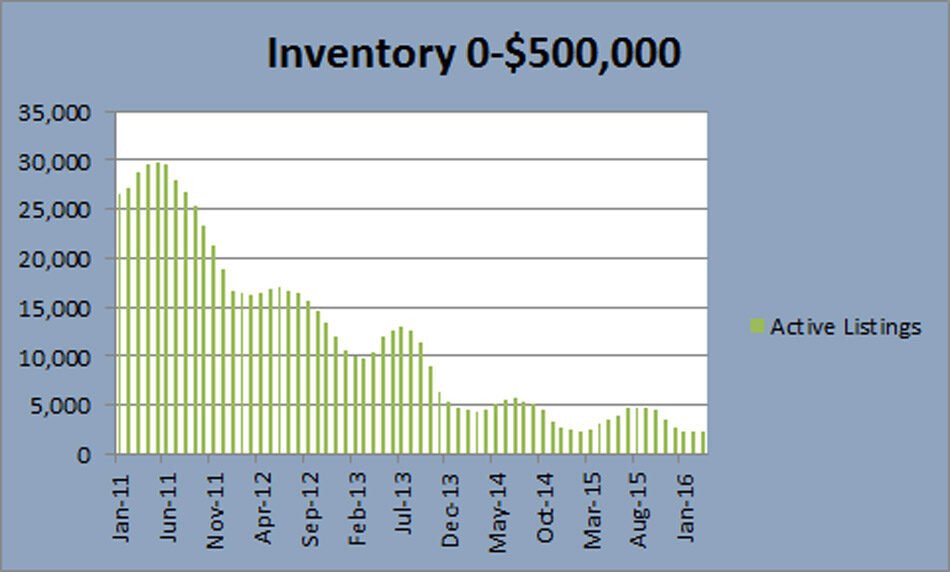
The highest demand in our market is typically for starter homes that can have a more affordable mortgage payment than monthly rent with current interest rates (see interest rates article here). Between March 2015 to March 2016, the inventory available under $500,000 dropped 10% from 2,471 homes to 2,225 in just one year. Part of this significant decrease is due to the price increases that have pushed many homes above this price range, but another factor is the demand for affordable homes.
Even more startling is the change in inventory from March 2011 to March 2016. In this five-year period, available homes priced under $500,000 dropped more than 92%, from 28,859 to 2,225.
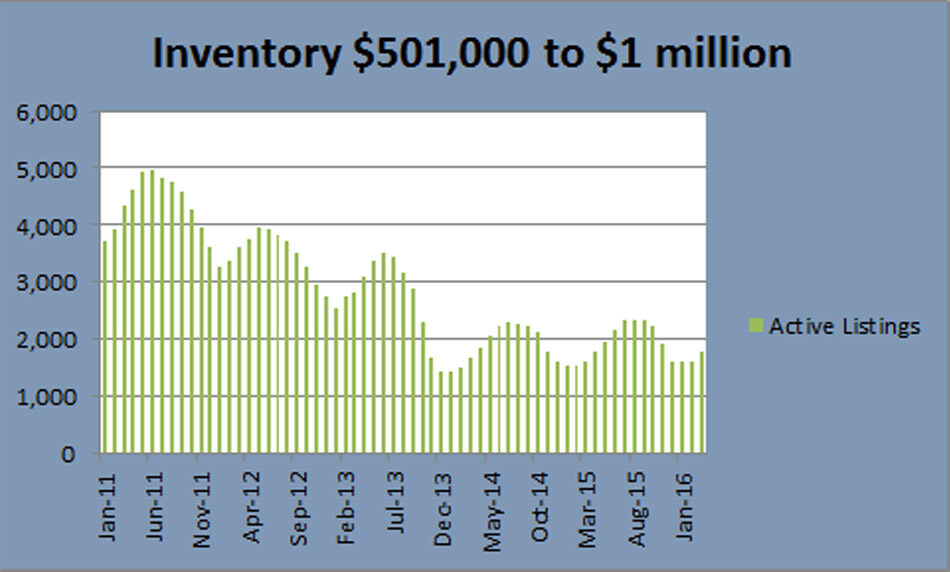
From March 2011 to March 2016, inventory of homes priced $501,000 to $1 million also decreased by almost 60% but we’ve seen a 12% increase in inventory in this price range in the last year from 1,591 to 1,786. Yearly sales in this price range have increased as many people take advantage of increased equity gained in the lower price ranges and low rates to buy their long-term or dream home.
Days on Market (DOM)
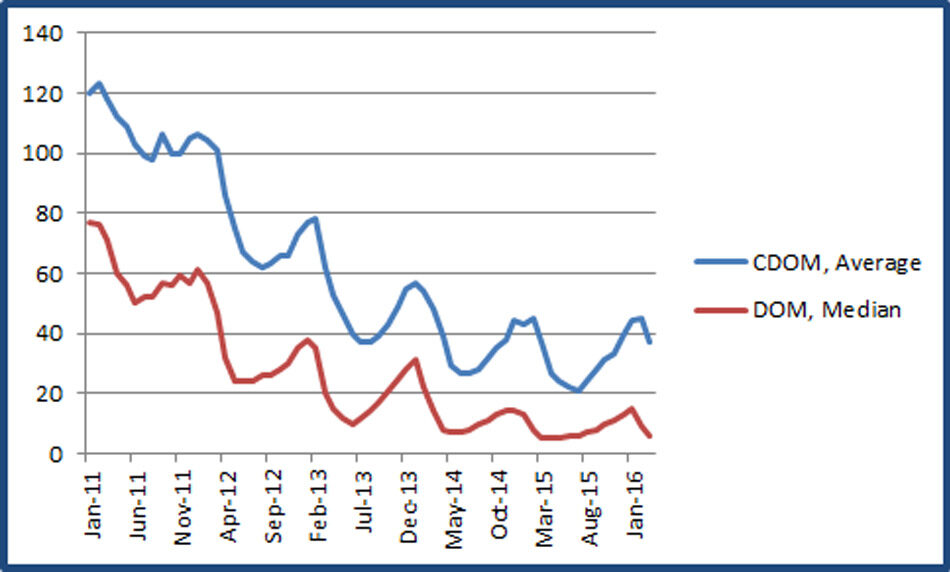
The health of a real estate market is often measured in days on market (DOM). The Denver area has experienced a significant decrease in the average and median days on market. The chart below shows the decrease over the last five years. The average DOM in March 2016 was 37 days and the median was just five. This reveals how much variance there can be in the DOM. The median of just five days indicates that half the homes sell in five days or less, but the average at 37 means that there are many homes that take significantly longer than the 37-day average to sell. The perception is often that every home sells immediately but the average versus median DOM shows that this is not true. The variance in DOM can be addressed with strong real estate expertise and proper pricing. This is an important point for both buyers and sellers to understand. If you are selling, accurate information and guidance on inventory in your price range and area will potentially make a huge impact on your final sale price. If you are a buyer, understanding the inventory levels for your price range and preferred area should alter your strategy and decisions. Most important for anyone buying or selling is using factors like inventory to help set your expectations and make informed decisions.
Months of inventory
Another popular measure of housing market strength is months of inventory. Most experts agree that 5-6 months of inventory available represents a balanced, healthy market. In March 2011, Denver was showing 11 months of inventory. One year later in March 2012, Denver had six months of inventory. In 2015 and 2016, we have had just one month of inventory. Housing inventory can provide valuable insights into market strengths and weaknesses to make strong and accurate real estate decisions. This is just one of many factors that any buyer or seller should consider before taking action.
Inventory can also provide insights into the potential for a Denver real estate “bubble” which we will explore in an upcoming post. (sign up for alerts here)
Navigating Denver’s housing inventory
Understanding housing inventory is extremely important for buyers and sellers in today’s Denver market. Experienced real estate professionals should consider specific price ranges and certain areas to provide insight on how to navigate our current inventory.
*All data is from Denver Metrolist MLS April 2016. The data does not include all “new build” homes excluded from the MLS.
*Denver metro area = Adams, Arapahoe, Boulder, Broomfield, Denver, Douglas, and Jefferson Counties